
 English
Financial Profile
WE PUT FINANCIAL STRENGTH AND STABILITY FIRST
Our strategy is as straightforward as it is simple. We make sure that we hold enough capital to provide our Members with a high enough level of security to meet their claims. A strong balance of capital also offers greater certainty of what costs might be, not least because it all but eliminates unbudgeted calls. In fact, we haven’t had to make an unbudgeted call in over 50 years.
On February 20, 2025, our capital stood at USD540m. Upon renewal of the 2025/26 policy year, a capital distribution of USD29m was made to all renewing members, following which, capital distributions amounting to USD159m have been made to Members since May 2017.
WE’RE CONSERVATIVE WITH OUR INVESTMENTS
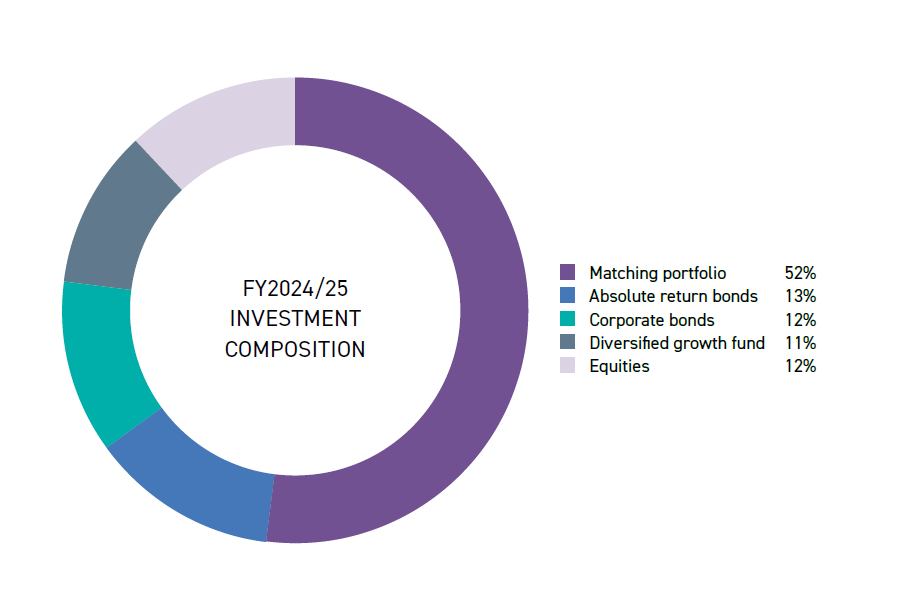
We employ a cautious investment strategy. Our aim is always to preserve capital yet, at the same time, achieve a respectable rate of return, one that supports our underwriting activity. As you might expect, this calls for us to invest in a diverse range of assets. In detail, these are cash, to maintain liquidity, and five types of bond: government, conventional, index-linked, corporate and absolute return. In addition, we invest in diversified growth funds and equities. On February 20, 2025 these investments totalled USD1.1bn.
In the year to February 20, 2025, the overall return on investments was 8.1% which is equivalent to a return of USD76.7m.
AN ‘A-’ CREDIT RATING FROM STANDARD & POOR’S
S&P revised their rating of the Britannia Group to A- (Stable) in December 2024 and at the same time re-confirmed the Britannia Group’s capital strength above S&P’s ‘AAA’ rating (now called its 99.99% confidence level) and its exceptional liquidity, the highest rating for both.
|
KEY FINANCIAL DATA |
||
|---|---|---|
|
|
|
|
| ENTERED TONNAGE (OWNED) | 140.9 | 141.7 |
| ENTERED TONNAGE (CHARTERED) | 51.9 | 55.2 |
| USD(‘000) | USD(‘000) | |
| CALLS AND PREMIUMS | 288,216 | 288,815 |
| NET CLAIMS INCURRED | (260,776) | (181,261) |
| INVESTMENT INCOME | 76,658 | 63,573 |
| NET OPERATING EXPENSES | (54,714) | (50,245) |
| NET (DEFICIT)/SURPLUS AFTER TAXATION | (9,819) | 58,243 |
| FREE RESERVES | 540,112 | 549,931 |
| COMBINED RATIO | 137.7% | 102.3% |
| EXPENSE RATIO | 14.44% | 13.58% |
| STANDARD & POOR’S RATING | A- (stable) | A (negative) |